Is reducing workload an effective way to increase value?
Tim Duncan averaged over 39 minutes per game in his career before the age of 26. Since then, his minutes have steadily decreased, reaching a career low of 31.3 MPG last year. Despite this decrease in minutes, his production per minute is quite comparable before and after age 26. Clearly, much of this reduction in minutes can be largely associated with age and the wear and tear often associated with aging.
Duncan also averaged over 37 MPG in the playoffs last year, so this reduction in minutes also includes some level of preservation. Soon the Spurs will need to weigh their level of wear and tear for not only Duncan, but Parker, Ginobili and even the Spurs young talent as they balance current contributions with long term conservation.
The issue of measuring career preservation is a tricky task to tackle. In the parallel issue of pitch counts and pitcher burnout in baseball, the debate has often been heated. Over 10 years ago, Rany Jazayerli created a system introducing Pitcher Abuse Points (PAP) in which he suggests weights of abuse on pitchers when they throw over 100 pitches in a game (he seems to focus on young pitchers). Many major league teams appear to make decisions roughly in line with these guidelines.
However, individuals such as Steve Treder have expressed doubts regarding the current pitch count system in place. Even Bill James chimes in, saying that Jazayerli and Woolner’s “research is so flawed that it is virtually useless.” Although it seems logical to assume that fatigued pitchers are more likely to encounter injury problems, there is not a consensus whether or not this tendency should be a significant factor considering taking starting pitchers out of a game.
The problem with analyzing the impact of fatigue on career longevity is that the best players tend to play more games, play longer in each game and have longer careers. This means that players who play more games and minutes (or pitches) also tend to have longer careers, so player ability must be considered at the same time as player “abuse”, which can be easier said than done.
The Method – Predicting Longevity
In order to try to account for this problem, I selected players with at least 2,000 minutes from the ages 28 and 29 and predicted Mean Expected Wins Added (MEWA) beyond age 29 (Mean Expected Championships Added was too variable to yield significant results) using regression analysis.
In this projection, I used an estimate of value per minute (basic statistical plus/minus or SPM), an estimate of perceived value and health (MPG) and a combination of the both (MEWA/gm). The formula I used to predict MEWA after 29 was 85*MEWA/GP + 0.72*MPG + 3.05*SPM +0.95*Max(0,SPM)^2; not below 0.
MEWA, MPG and SPM were cumulative for age 28 and 29. I summarized the data, excluded all players who were expected to have fewer than 10 MEWA after 29 and included only players who turned 30 after 1980 and “retired” before the 2010 season.
Whose Longevity Defied Expectation?
The following table lists MP during ages 28 and 29, predicted Mean Expected Wins Added after 29 (based on performances at 28 and 29), actual Mean Expected Wins Added after 29 and the respective ratio of [Actual Wins/[Expected Wins] entitled “Longevity Ratio”. Games played before 28 and MPG before 28 are also included.
NBA MEWA vs Expected after 29
| Player | MP 28,29 | Predicted MEWinA30+ | Actual MEWinA30+ | Longevity Ratio | GPpre28 | MPGpre28 |
|---|---|---|---|---|---|---|
| Charles Oakley | 5048 | 17 | 56 | 326% | 384 | 32.2 |
| Eddie Johnson | 4634 | 14 | 45 | 322% | 402 | 32.1 |
| Kevin Willis | 4646 | 17 | 56 | 321% | 320 | 27.5 |
| Brent Barry | 3907 | 27 | 85 | 310% | 155 | 21.0 |
| Sam Perkins | 5528 | 30 | 94 | 309% | 317 | 32.0 |
| Vinnie Johnson | 4002 | 15 | 42 | 290% | 208 | 25.2 |
| Dikembe Mutombo | 5953 | 41 | 112 | 272% | 153 | 37.5 |
| Mark Jackson | 5828 | 27 | 73 | 267% | 389 | 31.4 |
| Buck Williams | 5083 | 23 | 60 | 261% | 491 | 36.7 |
| Avery Johnson | 4362 | 21 | 53 | 255% | 137 | 11.3 |
| Dell Curry | 4114 | 22 | 53 | 245% | 337 | 18.8 |
| Antoine Carr | 2291 | 10 | 25 | 243% | 224 | 16.2 |
| Anthony Mason | 4399 | 23 | 55 | 243% | 187 | 25.7 |
| Karl Malone | 6356 | 95 | 223 | 236% | 407 | 36.3 |
| Tim Hardaway | 2321 | 38 | 88 | 232% | 308 | 38.4 |
| Reggie Miller | 5592 | 62 | 143 | 231% | 402 | 34.0 |
| Sam Cassell | 3004 | 38 | 84 | 222% | 209 | 22.4 |
| Bobby Jackson | 3398 | 22 | 48 | 222% | 191 | 21.0 |
| Olden Polynice | 3133 | 13 | 28 | 218% | 289 | 13.7 |
| Ricky Pierce | 3470 | 29 | 62 | 217% | 233 | 19.6 |
| Dennis Rodman | 4585 | 35 | 75 | 213% | 159 | 20.8 |
| Clifford Robinson | 5578 | 41 | 86 | 213% | 328 | 25.0 |
| Michael Cage | 4736 | 23 | 49 | 211% | 385 | 29.3 |
| Tom Chambers | 5698 | 26 | 55 | 207% | 389 | 33.1 |
| Doug Christie | 4707 | 27 | 56 | 207% | 204 | 25.8 |
| Bill Laimbeer | 5783 | 40 | 83 | 206% | 295 | 30.8 |
| Detlef Schrempf | 5237 | 39 | 80 | 204% | 342 | 22.5 |
| P.J. Brown | 4954 | 31 | 63 | 202% | 240 | 30.7 |
| Mitch Richmond | 4625 | 28 | 55 | 200% | 314 | 37.1 |
| Danny Ferry | 2255 | 14 | 27 | 199% | 225 | 18.0 |
| Johnny Newman | 4128 | 13 | 25 | 198% | 297 | 23.0 |
| Antonio Davis | 4427 | 18 | 36 | 197% | 125 | 22.1 |
| Robert Horry | 2936 | 33 | 64 | 195% | 317 | 31.8 |
| Steve Kerr | 2077 | 24 | 47 | 191% | 209 | 17.1 |
| Dale Davis | 4763 | 29 | 55 | 188% | 364 | 29.7 |
| Eric Piatkowski | 2982 | 17 | 31 | 186% | 211 | 13.0 |
| John Stockton | 6018 | 114 | 210 | 184% | 410 | 27.6 |
| George Lynch | 2802 | 15 | 27 | 181% | 244 | 19.6 |
| Armen Gilliam | 4513 | 19 | 34 | 180% | 170 | 30.3 |
| Patrick Ewing | 6269 | 69 | 120 | 174% | 275 | 34.3 |
| Vlade Divac | 5310 | 35 | 60 | 172% | 441 | 29.3 |
| Jeff Hornacek | 5811 | 57 | 96 | 169% | 307 | 27.9 |
| A.c. Green | 5066 | 29 | 49 | 169% | 407 | 28.6 |
| Scottie Pippen | 5882 | 72 | 120 | 166% | 398 | 33.6 |
| Anthony Peeler | 2493 | 17 | 28 | 164% | 253 | 22.7 |
| Sedale Threatt | 2701 | 24 | 39 | 162% | 251 | 18.1 |
| Frank Brickowski | 2310 | 16 | 25 | 160% | 118 | 12.1 |
| Tyrone Corbin | 6207 | 28 | 45 | 160% | 155 | 18.4 |
| Hersey Hawkins | 5383 | 36 | 58 | 159% | 403 | 36.1 |
| Dale Ellis | 5980 | 41 | 65 | 158% | 293 | 22.3 |
| Bob Sura | 3462 | 10 | 16 | 157% | 330 | 22.5 |
| James Donaldson | 2833 | 18 | 27 | 154% | 314 | 22.3 |
| Kurt Rambis | 3087 | 17 | 26 | 153% | 271 | 19.5 |
| Ruben Patterson | 3305 | 11 | 17 | 151% | 256 | 23.7 |
| Mark West | 2934 | 22 | 33 | 150% | 180 | 15.1 |
| Chuck Person | 5908 | 16 | 24 | 150% | 398 | 35.3 |
| Otis Thorpe | 5986 | 30 | 46 | 149% | 403 | 31.7 |
| Ron Harper | 6114 | 33 | 50 | 148% | 267 | 35.2 |
| David Wesley | 4693 | 31 | 45 | 144% | 267 | 26.3 |
| Antonio Daniels | 2384 | 23 | 33 | 143% | 350 | 22.9 |
| Dominique Wilkins | 5945 | 54 | 77 | 142% | 401 | 36.7 |
| Gary Payton | 6375 | 84 | 118 | 141% | 409 | 32.4 |
| Hakeem Olajuwon | 4698 | 93 | 129 | 139% | 468 | 36.6 |
| Donyell Marshall | 4078 | 41 | 56 | 137% | 348 | 25.6 |
| Aaron Williams | 2003 | 15 | 21 | 136% | 87 | 9.8 |
| Mark Eaton | 5364 | 24 | 33 | 135% | 163 | 22.5 |
| Dan Majerle | 6406 | 46 | 63 | 135% | 286 | 30.5 |
| Hotrod Williams | 4069 | 35 | 47 | 134% | 239 | 29.1 |
| Joe Dumars | 6238 | 33 | 44 | 133% | 387 | 31.3 |
| Kevin Mchale | 5050 | 57 | 76 | 133% | 328 | 27.1 |
| Craig Ehlo | 4761 | 27 | 36 | 133% | 211 | 14.5 |
| Nick Van Exel | 4752 | 21 | 28 | 132% | 378 | 34.8 |
| Cuttino Mobley | 6159 | 29 | 38 | 131% | 209 | 33.3 |
| Danny Ainge | 5517 | 44 | 56 | 129% | 359 | 24.3 |
| Gerald Henderson | 4736 | 20 | 25 | 127% | 322 | 18.8 |
| Horace Grant | 5315 | 52 | 66 | 126% | 399 | 32.3 |
| Clarence Weatherspoon | 2075 | 26 | 33 | 126% | 400 | 37.1 |
| Byron Scott | 5198 | 35 | 43 | 125% | 394 | 30.2 |
| John Starks | 4534 | 40 | 50 | 124% | 179 | 20.2 |
| John Paxson | 3626 | 15 | 18 | 124% | 284 | 21.0 |
| Trent Tucker | 2939 | 20 | 24 | 122% | 295 | 22.6 |
| Jerome Kersey | 5202 | 37 | 45 | 120% | 393 | 25.1 |
| Clyde Drexler | 5535 | 79 | 94 | 119% | 478 | 33.0 |
| Derrick Coleman | 2397 | 30 | 36 | 118% | 292 | 35.4 |
| Stacey Augmon | 2586 | 18 | 21 | 118% | 313 | 30.6 |
| Rod Strickland | 5156 | 50 | 58 | 117% | 325 | 27.6 |
| Eddie Jones | 3531 | 76 | 88 | 115% | 294 | 34.3 |
| Danny Schayes | 3722 | 23 | 26 | 115% | 332 | 17.7 |
| Larry Nance | 3475 | 65 | 75 | 115% | 378 | 30.9 |
| Brian Shaw | 3873 | 11 | 12 | 114% | 246 | 28.9 |
| Greg Buckner | 2225 | 12 | 14 | 114% | 204 | 20.3 |
| Elden Campbell | 5215 | 37 | 42 | 114% | 361 | 22.5 |
| David Robinson | 6452 | 135 | 152 | 113% | 232 | 37.3 |
| Lorenzen Wright | 3656 | 13 | 14 | 113% | 383 | 25.0 |
| Jimmy Jackson | 2433 | 13 | 14 | 112% | 274 | 36.4 |
| Greg Anthony | 3039 | 30 | 33 | 112% | 232 | 22.4 |
| Charlie Ward | 3873 | 33 | 37 | 112% | 151 | 17.2 |
| Glen Rice | 6156 | 46 | 51 | 111% | 396 | 35.5 |
| Charles Barkley | 5379 | 97 | 106 | 110% | 468 | 37.1 |
| Derek Harper | 5975 | 51 | 55 | 109% | 402 | 29.0 |
| Aaron McKie | 4346 | 23 | 25 | 108% | 241 | 22.0 |
| Danny Manning | 2435 | 27 | 29 | 108% | 331 | 33.5 |
| Chris Whitney | 2068 | 16 | 17 | 107% | 250 | 12.2 |
| Matt Harpring | 3718 | 21 | 22 | 107% | 269 | 29.3 |
| Wesley Person | 3398 | 20 | 21 | 106% | 322 | 30.8 |
| Larry Bird | 6189 | 105 | 112 | 106% | 320 | 37.8 |
| Rod Higgins | 4075 | 23 | 25 | 106% | 303 | 20.6 |
| Steve Smith | 5675 | 42 | 45 | 106% | 269 | 33.9 |
| Greg Ostertag | 2601 | 13 | 13 | 102% | 326 | 20.6 |
| Bryon Russell | 3989 | 38 | 38 | 101% | 270 | 18.8 |
| Rodney Rogers | 3254 | 26 | 26 | 100% | 383 | 27.4 |
| Allan Houston | 4984 | 24 | 24 | 99% | 400 | 30.3 |
| Damon Jones | 4592 | 32 | 32 | 98% | 211 | 16.8 |
| Bo Outlaw | 3187 | 29 | 28 | 96% | 362 | 23.9 |
| Terry Porter | 5449 | 76 | 72 | 95% | 402 | 31.8 |
| Gerald Wilkins | 4508 | 14 | 13 | 95% | 405 | 30.9 |
| Dudley Bradley | 2074 | 11 | 11 | 95% | 286 | 19.3 |
| Chris Mullin | 6661 | 56 | 53 | 95% | 357 | 32.8 |
| Fred Hoiberg | 3092 | 28 | 27 | 95% | 139 | 11.6 |
| Terry Mills | 4170 | 20 | 18 | 94% | 260 | 26.7 |
| Nate Mcmillan | 3629 | 37 | 35 | 93% | 388 | 27.2 |
| Rik Smits | 4494 | 32 | 30 | 93% | 395 | 25.3 |
| Terry Cummings | 5645 | 40 | 37 | 93% | 470 | 34.5 |
| Alton Lister | 4100 | 21 | 19 | 92% | 323 | 22.0 |
| Jeff Malone | 4985 | 19 | 17 | 91% | 397 | 32.7 |
| Muggsy Bogues | 5579 | 33 | 30 | 90% | 402 | 27.9 |
| Orlando Woolridge | 3260 | 23 | 21 | 89% | 354 | 29.4 |
| Vinny Delnegro | 4309 | 28 | 24 | 88% | 229 | 21.6 |
| Rick Fox | 5359 | 27 | 23 | 88% | 368 | 22.7 |
| Mike Gminski | 3466 | 30 | 26 | 88% | 444 | 22.9 |
| Christian Laettner | 5422 | 38 | 32 | 85% | 262 | 34.3 |
| Adonal Foyle | 2359 | 16 | 13 | 84% | 312 | 18.8 |
| Mookie Blaylock | 5962 | 71 | 59 | 83% | 355 | 34.2 |
| Grant Long | 2263 | 31 | 26 | 83% | 401 | 31.4 |
| Howard Eisley | 4522 | 17 | 14 | 82% | 294 | 16.5 |
| Damon Stoudamire | 5453 | 31 | 25 | 81% | 301 | 36.6 |
| Pooh Richardson | 3885 | 14 | 11 | 80% | 320 | 34.5 |
| Larry Smith | 4815 | 18 | 15 | 80% | 360 | 30.0 |
| Alonzo Mourning | 3692 | 60 | 48 | 80% | 351 | 35.9 |
| Thurl Bailey | 5360 | 20 | 16 | 80% | 406 | 29.1 |
| Chris Gatling | 2035 | 30 | 24 | 80% | 206 | 15.3 |
| George Mccloud | 3648 | 29 | 23 | 80% | 247 | 15.7 |
| Sherman Douglas | 4837 | 18 | 14 | 79% | 238 | 29.7 |
| Spud Webb | 4921 | 25 | 20 | 77% | 357 | 18.2 |
| Corliss Williamson | 2500 | 18 | 14 | 75% | 337 | 25.2 |
| Sam Bowie | 2619 | 19 | 14 | 75% | 119 | 29.5 |
| Reggie Williams | 5345 | 29 | 21 | 73% | 130 | 19.9 |
| Tyrone Hill | 3511 | 28 | 20 | 72% | 357 | 25.2 |
| Magic Johnson | 5541 | 100 | 72 | 72% | 487 | 36.9 |
| Dee Brown | 2113 | 18 | 13 | 72% | 349 | 30.8 |
| Jason Williams | 3290 | 16 | 11 | 72% | 259 | 12.2 |
| Doc Rivers | 3988 | 56 | 40 | 71% | 365 | 29.4 |
| Kelvin Cato | 3167 | 20 | 14 | 70% | 217 | 17.3 |
| Randy Breuer | 2771 | 16 | 11 | 69% | 293 | 16.4 |
| Derrick Mckey | 5423 | 27 | 19 | 69% | 446 | 31.3 |
| Rolando Blackman | 5338 | 29 | 20 | 69% | 401 | 32.4 |
| Kendall Gill | 3617 | 38 | 26 | 68% | 382 | 31.0 |
| Eric Snow | 3967 | 28 | 19 | 68% | 257 | 22.6 |
| Herb Williams | 5296 | 25 | 17 | 68% | 304 | 31.7 |
| Shawn Bradley | 3902 | 30 | 21 | 68% | 289 | 28.6 |
| Toni Kukoc | 3713 | 73 | 49 | 68% | 156 | 28.2 |
| Brian Grant | 4093 | 22 | 15 | 67% | 291 | 30.0 |
| Terrell Brandon | 2289 | 49 | 32 | 67% | 457 | 26.6 |
| Harvey Grant | 4779 | 21 | 14 | 66% | 293 | 28.2 |
| Jerome Williams | 2017 | 25 | 17 | 66% | 242 | 19.6 |
| Dana Barros | 5646 | 38 | 25 | 65% | 372 | 20.1 |
| Scott Brooks | 2741 | 18 | 11 | 64% | 316 | 14.0 |
| Mark Blount | 2920 | 17 | 10 | 63% | 108 | 14.0 |
| Mark Aguirre | 5273 | 45 | 29 | 63% | 365 | 33.8 |
| Michael Jordan | 6136 | 201 | 126 | 63% | 427 | 39.0 |
| John Salley | 3196 | 17 | 10 | 62% | 387 | 21.9 |
| Antoine Walker | 3667 | 26 | 16 | 62% | 528 | 39.4 |
| Larry Johnson | 5025 | 26 | 16 | 62% | 377 | 38.8 |
| Kevin Johnson | 3801 | 45 | 27 | 61% | 387 | 36.6 |
| Kevin Gamble | 4421 | 21 | 12 | 60% | 288 | 22.9 |
| Tom Gugliotta | 4713 | 36 | 22 | 60% | 243 | 35.6 |
| Xavier Mcdaniel | 2873 | 20 | 12 | 58% | 393 | 33.7 |
| Adrian Griffin | 2753 | 19 | 11 | 58% | 116 | 19.9 |
| Vernon Maxwell | 4822 | 28 | 16 | 57% | 271 | 31.4 |
| Paul Pressey | 4761 | 46 | 25 | 56% | 240 | 25.6 |
| Nick Anderson | 4880 | 48 | 25 | 53% | 447 | 31.9 |
| Kiki Vandeweghe | 5820 | 37 | 19 | 51% | 365 | 33.7 |
| Isiah Thomas | 5917 | 37 | 19 | 51% | 555 | 36.7 |
| Rex Chapman | 3323 | 32 | 16 | 50% | 320 | 29.5 |
| Jalen Rose | 6097 | 26 | 13 | 49% | 438 | 25.2 |
| Ed Pinckney | 3082 | 33 | 16 | 49% | 345 | 19.7 |
| James Worthy | 5920 | 49 | 23 | 48% | 471 | 31.9 |
| Chris Morris | 3480 | 30 | 14 | 48% | 389 | 30.3 |
| Kenny Smith | 4631 | 29 | 14 | 47% | 334 | 34.2 |
| Jamal Mashburn | 5817 | 35 | 16 | 46% | 286 | 35.3 |
| Chris Webber | 4910 | 75 | 35 | 46% | 405 | 37.7 |
| Sleepy Floyd | 3468 | 38 | 17 | 44% | 366 | 32.1 |
| Shawn Kemp | 5519 | 36 | 16 | 44% | 544 | 29.2 |
| Vern Fleming | 4805 | 26 | 11 | 44% | 398 | 33.1 |
| Wally Szczerbiak | 3733 | 47 | 20 | 42% | 317 | 33.4 |
| Derek Anderson | 4418 | 36 | 15 | 42% | 250 | 31.5 |
| Travis Best | 4148 | 28 | 11 | 40% | 266 | 19.6 |
| Sean Elliott | 4294 | 31 | 12 | 39% | 469 | 34.3 |
| Mark Price | 4518 | 80 | 31 | 39% | 311 | 31.7 |
| Shareef Abdur-Rahim | 2596 | 30 | 11 | 37% | 533 | 38.1 |
| Lafayette Lever | 5806 | 72 | 26 | 36% | 404 | 30.3 |
| Alvin Robertson | 5197 | 46 | 16 | 35% | 389 | 32.2 |
| Michael Adams | 5141 | 43 | 14 | 33% | 319 | 30.4 |
| Jay Humphries | 5544 | 39 | 12 | 30% | 335 | 29.4 |
| Sidney Moncrief | 5301 | 59 | 17 | 28% | 392 | 32.5 |
| Anfernee Hardaway | 4197 | 43 | 12 | 27% | 319 | 36.9 |
| Kerry Kittles | 4550 | 49 | 13 | 26% | 267 | 34.8 |
| Stephon Marbury | 5475 | 43 | 10 | 24% | 505 | 38.4 |
The upper part of this list is littered with names that came into the NBA with little expectations and went on to have long, successful careers. Perhaps a late start tends to produce a later than expected finish. Could this be driven by matured players who enter the NBA with fundamentals that last late in their NBA lifetime?
The bottom of the list is full of players with injury-riddled careers. Note that I excluded players with fewer than 10 actual MEWA after 29. Many such players either returned to Europe before their skills or health greatly diminished. Others saw their careers end under tragic non-basketball related circumstances. I accounted for neither of these factors explicitly in my projection of MEWA after 29 and foreign players could especially skew the results. Increasing the minimum actual MEWA effectively eliminated these types of individuals.
Observations
The following is a graph displaying the averages of MP during ages 28 and 29 and Games Played and MPG before 28 for the top and bottom halves of the initial list (labeled “exceed” and “burnout”):
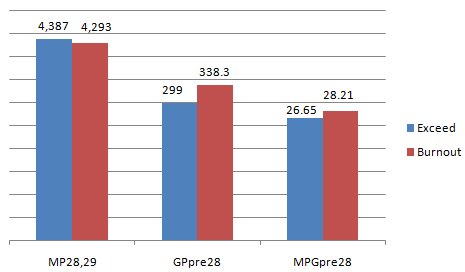
Notice that although average minutes during ages 28 and 29 are higher for those who exceed expectations, cumulative career MPG AND GP up to age 27 are actually LOWER by a statistically significant margin. In fact, I estimate that saving a season’s worth of games before 28 corresponds with an increase of about 12% career effectiveness after 29 (using regression analysis weighted by expected MEWA). Similarly, saving 5 MPG before 28 typically results in an increase in career effectiveness of roughly 6% after 29.
However, considering both of these variables simultaneously reduces these variables to about 10% and 2%. To try to put this in perspective, I did a quick estimate and found that the typical 82 games “saved” before age 28 tend to add, over the course of their career, about 1/4 of the wins contributed by that player for an 82 game season.
Clearly, resting the second of back-to back road games or games when nursing an injury would be expected to have a more significant impact on career longevity. Most games in which such a player is not required to rest, but considered for rest by the team or player, fit these circumstances. Therefore, the above estimates really suggest that a season’s worth of borderline, “Should I play or should I rest?” games before age 28 tend to improve career effectiveness by 12% for the age of 30 and beyond.
Additionally, one might suspect that as players age, the 12% improvement in career effectiveness increases; but since the time available to make up the lost player contributions for a season are lessened, these players might “only” be expected to add 1/4 or less of one season’s wins contributed over the course of their career. (See the end of last week’s post for a basic expectation of the Spurs player’s future contributions.)
The aforementioned decrease of the impact of MPG when combined with GP in the regression model indicates the correlation of MPG and GP. The fact that GP is less affected suggests to me that MPG might be largely reduced because of injury, when minutes are most significantly reduced in line with a reduction in games played. Maybe players who give injuries more time to recover instead of pushing through last longer. Perhaps these players just know how to take care of their bodies. The tendency for players recovering from injury to perform at lower levels adds to the list of reasons to not rush a return.
From a coaching or organizational perspective, much else must be considered in addition to games and minutes played for each individual. Just to name a few, factors such as how a player is feeling, team need, medical advise all play significant roles. Unfortunately the available data doesn’t seem good enough to shed any more light on potential factors causing the results in my study.
Reducing Player Minutes
You might be thinking “Ok, great. So now there is support for the widely accepted theory that saving players prolongs careers, now what? Sitting the best players hurts the team for the current game and season.” There is at least one more important factor must be considered. Not all minutes are created equal.
Clearly, playing Duncan at the end of a 30-point blowout does more harm than good, so in order to maximize his impact given his “allotted minutes” (not that there should be a hard number), he should play in as many high leverage situations that fit his skill set as possible. My article on Clutch Adjusted Plus/Minus displays the comeback probabilities given the deficit and time remaining (see Comeback Probability Table).
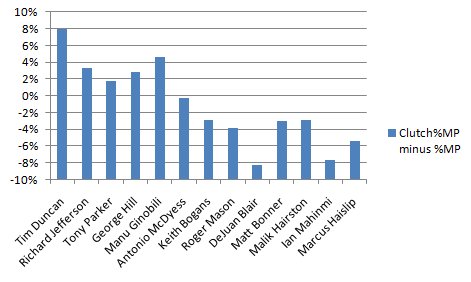
Weighing minutes played by the impact of 3 points on comeback probability, we do find that the best players typically play a higher percentage of the team’s minutes. The following chart shows the differences between the Spurs player’s percentages of team minutes and clutch-weighted minutes:
And finally, here is a table of some select players:
| Player | Tm | GP | MP | %MP | %Clutch Wt MP | Diff |
|---|---|---|---|---|---|---|
| Beno Udrih | SAC | 79 | 2477 | 65% | 80% | 16% |
| Jason Terry | DAL | 77 | 2540 | 68% | 82% | 14% |
| Jason Kidd | DAL | 80 | 2881 | 74% | 87% | 13% |
| Kevin Garnett | BOS | 69 | 2060 | 62% | 70% | 9% |
| LeBron James | CLE | 76 | 2966 | 81% | 89% | 8% |
| Tim Duncan | SAS | 78 | 2438 | 65% | 73% | 8% |
| Dwyane Wade | MIA | 77 | 2792 | 75% | 83% | 8% |
| Steve Nash | PHO | 81 | 2660 | 68% | 75% | 7% |
| Monta Ellis | GSW | 64 | 2647 | 86% | 92% | 6% |
| Kobe Bryant | LAL | 73 | 2835 | 80% | 86% | 6% |
| Kevin Durant | OKC | 82 | 3239 | 82% | 88% | 6% |
| Dwight Howard | ORL | 82 | 2843 | 72% | 77% | 5% |
| Manu Ginobili | SAS | 75 | 2150 | 59% | 64% | 5% |
| Andre Iguodala | PHI | 82 | 3192 | 81% | 85% | 4% |
| Rudy Gay | MEM | 80 | 3175 | 82% | 86% | 4% |
| Richard Jefferson | SAS | 81 | 2520 | 64% | 68% | 3% |
| George Hill | SAS | 78 | 2276 | 60% | 63% | 3% |
| Gerald Wallace | CHR | 76 | 3119 | 85% | 87% | 3% |
| Tony Parker | SAS | 56 | 1728 | 64% | 66% | 2% |
| Antonio McDyess | SAS | 77 | 1617 | 44% | 43% | 0% |
| Malik Hairston | SAS | 47 | 317 | 14% | 11% | -3% |
| Keith Bogans | SAS | 79 | 1559 | 41% | 38% | -3% |
| Matt Bonner | SAS | 65 | 1161 | 37% | 34% | -3% |
| Aaron Brooks | HOU | 82 | 2919 | 73% | 70% | -3% |
| Roger Mason | SAS | 79 | 1515 | 40% | 36% | -4% |
| Luis Scola | HOU | 82 | 2671 | 67% | 62% | -5% |
| Marcus Haislip | SAS | 10 | 44 | 9% | 4% | -5% |
| Ian Mahinmi | SAS | 26 | 165 | 13% | 5% | -8% |
| DeJuan Blair | SAS | 82 | 1494 | 38% | 29% | -8% |
| Mike Miller | WAS | 54 | 1805 | 69% | 59% | -10% |
Notice how the better and/or older often are at the top of the [clutch-weighted minutes – actual minutes] list. It is also interesting to note that two of the most historically statistically-oriented teams are in opposite ends of the spectrum. The Mavs are arguably the team whose best player’s clutch-weighted minutes increase the most. Meanwhile, the Rockets best player’s clutch-weighted minutes seem to increase the least (or even decrease).
This could be somehow related to Daryl Morey’s comments on last year’s Sloan Sports Conference that the Rockets don’t make decisions accounting for clutch performance, to which Mark Cuban chimed in saying that his team has accounted for this factor in the past. Or it could just be because the Rockets have more role players who don’t always fit in “clutch†situations while the Mavs have older players on a more top-heavy team.
In summary, the Spurs best players can be effectively utilized over the long haul if Coach Popovich adequately focuses on resting key players during injury-related times, typically coinciding with events that have a low probability of impacting the Spurs’ 2011 results. I’m sure Coach Pop would not be surprised at all by this by this effect, but attaching some magnitude to this result, even a vague magnitude, can help with adjusting or assuring instinctive decision making. With the future in mind, perhaps Duncan, Ginobili and Parker shouldn’t play elite minutes for the Spurs this year, but still play elite “effective minutes†if healthy.


Huh? Just kidding…nice article and good insight on how reducing workload at key times can help or hurt, depending on the personnel and the age of the players.
Two Things:
1. Your last graph shows Tim, Manu, RJ, Hill, and Parker in that order of decreased (Clutch%MP – %MP) as our top used “clutch” lineup which coincides with what I observed last year. I’m not sure Tiago cracks this top 5 this season which further supports my claims that Pop will use small to close games, especially when we are trailing. RJ can vastly improve the Spurs chances if he has worked on playing small ball 4 within our system over the summer.
2. I get the logic behind wanting to maximize your best players talent against the best teams in the closest of situations. I counter with this: a regular season win against the Nets is equal to a regular season win against the Lakers. Let’s say the Spurs are expected to win against the Lakers 40% of the time compared to 90% of the time against the Nets with our full lineup. I think there is value in securing easy wins and a coach testing his role players against better teams. You can see this in how Pop is so willing to rest Duncan in games like the OKC game last season and when he rested all the starters on the Rodeo Road Trip @ Denver the year before.
So my point is, we need Duncan and Manu to play against the worst teams so they are never clutch situations. We then should be in a W-L record situation to not allow an opposing good team to dictate our rotation or player minutes which should lower the Clutch%MP for our most valuable players.
Last season, injuries and other factors forced a poor record which then forced Pop to not rest Duncan and Manu.
I guess these are just some of the details a head coach must balance.
That makes sense. Limit (or reduce) the Big 3′s overall minutes played, while maintaining (or even increasing) their critical minutes played.
BlaseE,
I can see some potential long term value in “testing” role players against better teams. I also understand that more difficult tasks might have a more significant impact on wear and tear. But in terms of getting wins, Lakers are closer to 50% and would be a higher leverage situation.
Let me illustrate:
For simplicity, I’ll assume the Spurs average 100 PPG against all teams and all of Duncan’s impact is all on the defensive end. Let’s also assume the Spur’s winning percentages of 40% and 90% against the Lakers and Nets are without Duncan (this just makes the pattern more obvious). Finally, let’s say that the Spurs expect to allow 6 fewer points in games Duncan plays, against all matchups.
Without Duncan:
Lakers W%=40% => Avg Score 100-102.9
Nets W%=90% => Avg Score 100-85.5
With Duncan:
Lakers Avg Score 100-96.9 => W%=61%
Nets Avg Score 100-79.5 => W%=96%
Expected Difference:
Playing against Lakers = 61%-40% = 0.21 Wins Added
Playing against Lakers = 96%-90% =0.06 Wins Added
We can see that Duncan playing agains the Lakers can be expected to be worth over 3 times as much as against the Nets.
Damnit Scott,
Still over my head!
‘cept Blase is advocating the opposite, play the ‘starters’ to secure early leads against bad teams, play the ‘role players’ more than usual in clutch situations, against both bad and good teams. Critical/Clutch minutes aren’t bad for veterans, but they might be good for rookies…
Of course fate will probably push Pop’s hand with injuries or setbacks or surprises. In practice, it wouldn’t look much different than what we saw last year. I just hope everybody stays healthy so strategy like this be a reality.
above RE: tyler, not scott
Thanks for the follow up. My point is that you are looking at wins added but I’m talking about wins lost. If you play Duncan in one game, wouldn’t you rather have a .96 wins lost as secure as possible compared to .61 wins lost.
Let’s say Duncan plays in 1 game. If he plays in the Lakers game, you could expect 1.51 wins out of the 2 games, but you have a higher chance of losing both games in a small sample size (like 1 set of games). If he plays in the Nets game, it drops to 1.36 wins out of 2 games, but you’ve given yourself the best chance to secure 1 win. I think my point would be stronger if it wasn’t the Nets at 90% which should be a guaranteed win in most people’s eyes. Let’s say instead a team like New Orleans where we might have a .75% chance to win last season (yes, I’m aware we won all 4 games). I think you want Duncan to secure the Hornets win and you risk the Lakers loss in a back to back situation.
I think you’re numbers make more sense when you are looking at reducing minutes over an entire season. I’m just trying to rationalize the team you rest Duncan/Manu/Parker against on a single back to back.
I’m thinking there are games against poorer competition where Duncan can secure a win in 25 minutes of PT, but in order to get to close games against good competition, Duncan may need to play 35+ minutes. To me, its more important to not lose the little games than it is to win the big games (especially within your conference).
Blase – Good explanition…
not a big fan of these articles. were you guys all political science majors?
Greyberger
September 24th, 2010 at 11:44 am
‘cept Blase is advocating the opposite, play the ‘starters’ to secure early leads against bad teams, play the ‘role players’ more than usual in clutch situations, against both bad and good teams. Critical/Clutch minutes aren’t bad for veterans, but they might be good for rookies…”
Very good point.
BlaseE
September 24th, 2010 at 12:05 pm
“I’m thinking there are games against poorer competition where Duncan can secure a win in 25 minutes of PT, but in order to get to close games against good competition, Duncan may need to play 35+ minutes. To me, its more important to not lose the little games than it is to win the big games (especially within your conference).”
Yes, point well-taken. During the regular season of course. The playoffs are a different story. And that’s a key consideration: How many minutes do we play what players in what type of games to best prepare the TEAM for an upcoming playoff run. For example, if we were to get in a long playoff run, we cannot afford to play TD 37-40 mpg. in a HIGHLY active role against the toughest competition. We’ll burn him out by the 2nd round at this stage of his career (e.g., 2010 Suns series), regardless of how much rest we could possibly afford him during the regular season. Thus, while it makes sense to play our older, “important” players less on average during the regular season & playoffs, more importantly we must aggressively develop our younger players during the regular season (play them enough overall, and in tight situations against high-level competition) so that they’re capable of making key contributions with meaningful minutes during the playoffs.
Scott’s data supports the notion of resting injured players (even if relatively minor) where at all possible, and play the team’s best performers heavier minutes in clutch situations against tough competition. Generally speaking, I agree with that assessment, particularly when a team’s top performers are relatively young, durable, and injury free. However, it is my belief (based merely on observation) that Duncan & Ginobli (our two top performers) are no longer as effective at this stage of their careers when playing too many minutes against difficult competition over too short of a period of time. An extended, hard fought playoff run to the WCF’s would be an example of this. As a result, in my view, it is crucial for this team to push the development of a handful of key young players on the team (e.g., Hill, Blair, Splitter, Anderson….) to the point where one or more of them turn into consistent & strong producers against tough competition in key situations during a big game (as close to simulating during the regular season what one can expect in a playoff series). And I would employ this approach even if it ended up costing us a handful of games, and a 6th seed instead of a 3rd seed (losing home court in round one, and probably beyond). We are simply no longer in the position to have Duncan & Ginobli carry us by playing “heavy” minutes (i.e., averaging more than 34-35 mpg.) through several back-to-back hard-fought playoff series against elite competition. We need to accept this reality and make the appropriate adjustments if we plan on getting a realistic crack at the WCF’s.
Right, it is all about making moves that improve the odds of winning a title.
I’m going to second or third that BlaseE’s well summarizing his perspective:
“I’m thinking there are games against poorer competition where Duncan can secure a win in 25 minutes of PT, but in order to get to close games against good competition, Duncan may need to play 35+ minutes. To me, its more important to not lose the little games than it is to win the big games (especially within your conference).”
This is logical, but I wouldn’t suspect that this strategy will make up for the lost value over those two games.
If Coach Pop feels like Duncan can really benefit from the rest of back-to-back road games, then perhaps a good solution would be to have TD come off the bench for the tougher game, assuming he can adjust that role. That way, he can use him sparingly initially and more when the game is in the balance or potentially not at all if the game is never is serious question.
Glad to have your insightful analysis. Keep it up.
@Greyberger
I was responding to the Scott’s piece, not BlasE
I have to say, though complicated, this deal could go down. However, if Anthony does not agree to sign a long-term extension, there’s NO way this deal goes through. I think he will sign, but it’s not like this would make the Net’s a juggernaut, a la the Heat, so it’s a big decision for Anthony. He could just as well wait and try to get to NY next summer. It depends on how bad he wants to get out of Denver, and the way he perceives the upcoming CBA fight, and looming lock out.
http://sports.espn.go.com/nba/news/story?id=5610989
There are lies, then there are Damn lies, then there are statistics. I had to listen into the late summer after the Spurs had won it all. I felt like sorry for the Lakers, because Shaq and Kobe were breaking up. (Not) What is this broken Back? The worst kind of liar, is the arragant one. Mean while, back at the ranch. If Tony was as nasty Jacque Vaughn, We would win another Title. Remmember when Tony was the only player to shut down Richard of Detroit. I like my Spurs like my coffie. Black and sassy. I wonder If Avery were coaching, if would he allow Pop not to play zone. If would have played Zone against the Suns, we would not have been swept. We would compete, but it would have come down to the low post game against the Lakers. I remmember, when Shaq and Kobe came to town. Duncan and Tony were out. Manu beat the Lakers, by himeself. He is the best point guard, that plays out of position. Jason Kidd, Jerry West, Manu. If I could not have Jordan, I would want Manu. Go Spurs Go
http://espn.go.com/nba/powerrankings
Stein’s usually pretty good, but I take issue with him on his “preseason power rankings”. Just for fun, here’s my power rankings:
Playoff Teams:
LA
Magic
Celtics
Heat
Rockets
Bulls
Blazers
Spurs
Mavs
Thunder
Jazz
Bucks
Nuggets
Hawks
NY
Possible fight for 8th spot/.500 record : +/- 5:
Suns (Amare big loss, but Nash makes everyone better)
Griz (solid young talent with a nice young coach)
Cats (what can I say, it’s Larry Brown’s team!)
Hornets (he’s baaacckk….!)
Clips (Griffin will awe people)
Kings (better than people think)
Cavs (will surprise under Byron Scott, minus Bron)
76ers (Collin’s has this team on the move)
Improvement for some: Still bottom of barrel
Pacers
Wiz
Warriors
Nets (*with Anthony trade, could move to next level)
Pistons
Raptors
T-Wolves
“Cats (what can I say, it’s Larry Brown’s team!)”
Actually, as of now, my power rankings make the Bobcats the 8th seed in the East.
Jim Henderson
“An extended, hard fought playoff run to the WCF’s would be an example of this. As a result, in my view, it is crucial for this team to push the development of a handful of key young players on the team (e.g., Hill, Blair, Splitter, Anderson….) to the point where one or more of them turn into consistent & strong producers against tough competition in key situations during a big game (as close to simulating during the regular season what one can expect in a playoff series). And I would employ this approach even if it ended up costing us a handful of games, and a 6th seed instead of a 3rd seed (losing home court in round one, and probably beyond). We are simply no longer in the position to have Duncan & Ginobli carry us by playing “heavy†minutes (i.e., averaging more than 34-35 mpg.) through several back-to-back hard-fought playoff series against elite competition. We need to accept this reality and make the appropriate adjustments if we plan on getting a realistic crack at the WCF’s.”
I agree 100% with this analysis.
And by playing the younger talent more against elite teams/players they (the younger talent) get exposed to the tendacies of the best prior to playoff rounds.
And if the circumstances are the same as last year being that the total win/loss record of teams entering the playoffs are but a 2 to 3 game difference…losing a couple of games to an elite team during the regular season while securing expected wins should not hender the ability to win in the playoffs. All the while helping the younger talent to perform better against the elite teams and the playoffs through baptism by fire during the regular season and providing ample rest during the regular season of the big three so as to be as fresh as possible for the playoffs.
@ Scott Sereday
This model shows how to best extend longevity.
It would be interesting to see a model showing player efficientcy against elite teams and below average teams. Taking into account how a player like Duncan, Ginobili or Parker performs against those types of teams.
Upon recollection…players may have a great 1st quarter then descend to a below average performance for the rest of the game or have a subpar performance for 3 periods only to have an above average performance in the last quarter.
I’m sure there’s a mental factor that allows great players to just turn it on. And I’m not sure how this would coincide with the top three playing limited minutes. Are these players that good that if they were to be injected into a game at ANYTIME they could still perform according to their respected averages?
I’m sure that would have a bearing upon making a decision to playing others on the team over Duncan and Ginobili.
Just FYI, this piece by Scott got a mention today by ESPN’s Abbott on his True Hoop Blog. Here’s Abbott’s comment:
“A big mess of data confirming the idea that resting players does prolong the productive part of their careers. One of the side points was that players who get a late start to their careers tend to be productive for a surprisingly long time. I wonder if that’s because those guys — almost never blue-chippers, and often without perfect NBA bodies — need every trick in the book to compete. Maybe the learned habits that get them in the league, from a good diet to trickery fighting for rebounds — are the things that keep them productive.”
Many of you may have heard, but here’s brief synopsis of the new rule change for this year regarding technical foul calls:
http://espn.go.com/blog/truehoop
For the upcoming season, NBA referees have been instructed to call automatic technical fouls when players do some things that are very common to the NBA game:
* Aggressive gestures, such as air punches, anywhere on the court.
* Demonstrative disagreement, such as when a player incredulously raises his hands, or smacks his own arm to demonstrate how he was fouled.
* Running directly at an official to complain about a call.
* Excessive inquiries about a call, even in a civilized tone.
I think the rule is stupid. What do you guys think?
It’s nonsense.
1.) If the rule is intended to placate those sports fans who can’t stand the NBA because ‘there’s too much complaining’ (or flopping or whatever), then I think it’s a mistake. That line of thinking (that basketball is rendered unwatchable by all those disrespectful/undisciplined/egotistical whiners) is fixated on behaviors that have very little to do with the game itself.
I understand that the NBA wants to market itself to those fans, but there’s a difference between courting them by banning informal dress on the bench (with which I nonetheless take issue) and punishing extremely common on-court behavior. Unlike flopping, arguing with foul calls does not break up the flow of the game. It also seems that the refs and the players for the most part have a mutual understanding of how to appropriately disagree, and how to appropriately ignore a complaint. Sure, we’ve seen that understanding break down on either side of the whistle (spectacularly between Tim Duncan and Joey Crawford) but I don’t think that tightening the leash on the players is the best way to prevent that from happening.
2.) On the other hand, if the refs feel that they’re unable to make the appropriate calls, or they feel consistently threatened or disrespected as a group because of the way players respond to fouls, I guess it’s worth a shot. In all fairness, their job is extremely difficult and if this might make it any easier, I can’t complain (heh). I always feel like officials need to get a break every now and then. They’re on the road every night (no homestands for refs), trying to call a game to the satisfaction of two opposing teams, a home crowd and the folks at home, knowing complete accuracy is both expected and impossible.
If they go through with this, however, I think it’s only fair that the players, coaches, owners et. al. are allowed to specifically criticize the officiating off the court without fear of reprisal from the league office. Knowing full well that this will never happen, they should abandon the whole thing.
The rules aren’t the problem in basketball. It’s the inconsistancy in which they’re applied.
This will yet be another instance of many instances where gray area will rule the judgement of the officials on the court. And just another tool fans will use suggesting the NBA favors certain teams making it to the finals.
This happens every few years where the league says they are going to crack down on players behaviors. You will see an increase in technicals initially but as the season goes on it will go back to normal. Its the leagues way of saving face and trying to show that they care about every opinion of every fan. It will be the same as when they started to call carrying on everyone and then they stopped. No biggie.
If the refs called the rules the same for everyone, regardless of whether or not they are Kobe, Lebron, Duncan, or Brian Scalabrine, Tony Battie, or Eddie House, than players might actually stop complaining so much.
Nothing irritates me more than hearing commentators and espn writers say “He deserves those calls because he’s a superstar.” No, he doesn’t. A foul should be a foul no matter who you are.
It seems like there’s always a good 10+ games a year (that I see) where one team can throw elbows and push, with no fouls, but the other team can’t even breathe without being whistled.
I know as a fan I’d rather see more consistent officiate, rather than see players not be able to complain. Hell, even if it was bad calls, as long as they are called the same, on both teams, all the time, I wouldn’t mind *so* much.
@ Scott
I think you are dead on. With the new goal to secure playoff seeding, Pop should start Duncan/Manu against the weaker team and play him off the bench against the harder team in back to backs.
I think Pop would be more likely to start Duncan the first game and bench him the second game though.
I think I read it on 48MoH going into last season the idea of resting Duncan or Manu in the first game and then flipping it for the second. They could be a good idea but instead of not dressing, benching.
The part of this whole “rest or play” analysis that seems to be lacking is that good coaches, like Pop, will be in constant communication with all the players (and his assistant coaches)about how the players are feeling, day to day, or even minute to minute, in games.
If George Hill is still really sore because of a fall in the lane on the road 3 nights ago, that may be much more important to Pop for tonight’s game than whether Tim played 32 or 37 minutes in the last game, as long as Tim is (honestly) saying that he feels really good tonight.
In other words, the whole thing comes down to making sure ALL factors are considered, not just how old someone is. For example, wouldn’t a fractured finger on a great shooter be more problematic for playing time purposes than the same fractured finger on a big who plays great defense and scores 70% of his points on dunks, tip ins, and layups?
The good coaches are paid very, very well, and it’s almost certain that they are way more plugged in to the situation than simply counting minutes and looking at a guy’s date of birth.
It appears that Parker is open to an extension, a la Manu last season. We’ll see.
http://twitter.com/spurs/statuses/25704965348
There’s one guy I’ve been mentioning:
http://twitter.com/JMcDonald_SAEN/status/25701506453
For those of you that would love to see Shaq’s ego cut down a size, apparently there’s no better way than to get a 5th ring for TD:
http://sports.espn.go.com/boston/nba/columns/story?columnist=macmullan_jackie&id=5620537
“But I don’t compete with little guards. I don’t compete with little guys who run around dominating the ball, throwing up 30 shots a night — like D- Wade, Kobe. “Now if Tim Duncan said it, I’d be pissed. He’s the only guy I’m competing with. If Tim Duncan gets five rings, then that gives some writer the chance to say ‘Duncan is the best,’ and I can’t have that.”
http://blogs.mysanantonio.com/weblogs/courtside/2010/09/camp-roster-fin.html
http://sports.yahoo.com/nba/news;_ylt=Al_0YZZ8xBCdbjhE2Yg6TSq8vLYF?slug=ap-spurs-parker
It could simply come down to price (unless we find a killer deal for him). Can’t afford to over-pay for Parker at this juncture, and the contract would have to be back-loaded to the max until TD’s contract comes off in 2012.
resting players don’t prolong their careers, working hard prolongs you and your career. Keeping players out of dangerous situations and resting them during dangerous times prolongs their careers for injuries are the main thing that ends careers. That’s why they should have kept Bowen. He’s a freak who never gets injured. They oughta call him back now.
anonymous
“resting players don’t prolong their careers, working hard prolongs you and your career. Keeping players out of dangerous situations and resting them during dangerous times prolongs their careers for injuries are the main thing that ends careers. That’s why they should have kept Bowen. He’s a freak who never gets injured. They oughta call him back now.”
From someone accustomed to speaking from emotion at times….You’re talking out of your pie hole instead of basing what you just said on any relevant fact.
Everything I said above is a relevant fact meaning true. Truth is generally not considered a virtue held by statisticians. How can you post without a name? Maybe you are the statistician writing this stuff. All these conclusions based on stats reminds me of these people in fantasy land playing G.M. based on their stat sheet. An ounce of wisdom can half way around the world before a pound of knowledge can get his britches on.